...
Detailed instructions on how to use it can be found here: https://github.com/NCAR/ADF/wiki
To Instructions to use the chemistry evaluation , you will need to checkout the branch: TBDare being developed here: Using chemistry diagnostics with CESM output
Our current atmospheric chemistry diagnostic development plans/wishlist (view on GitHub: https://github.com/NCAR/ADF/issues/237) are:
| Diagnostic | Example Plot/Result | Github Issue |
|---|---|---|
1. |
Chemistry/Aerosol budget Tables Tables / Chemistry of ANN global budgets |
COMPLETE https://github.com/NCAR/ADF/issues/236 example: https://project.cgd.ucar.edu/projects/ADF/chem-diags/budget-tables/html_table/mean_tables.html | ||
2. Zonal Average comparisons between model runs. Vertical Contour Plots contour plots of DJF, MAM, JJA, SON and ANN zonal means List of species to evaluate: TBD | Now with absolute and relative differences. | |
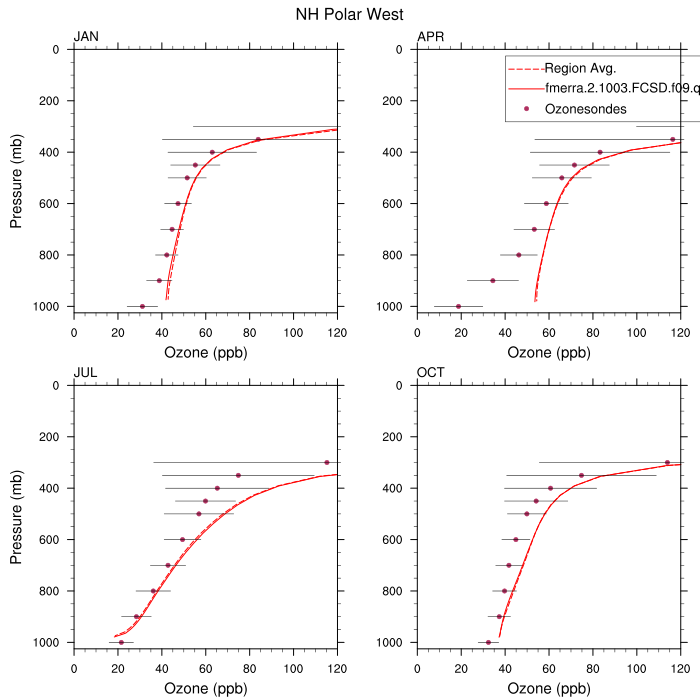
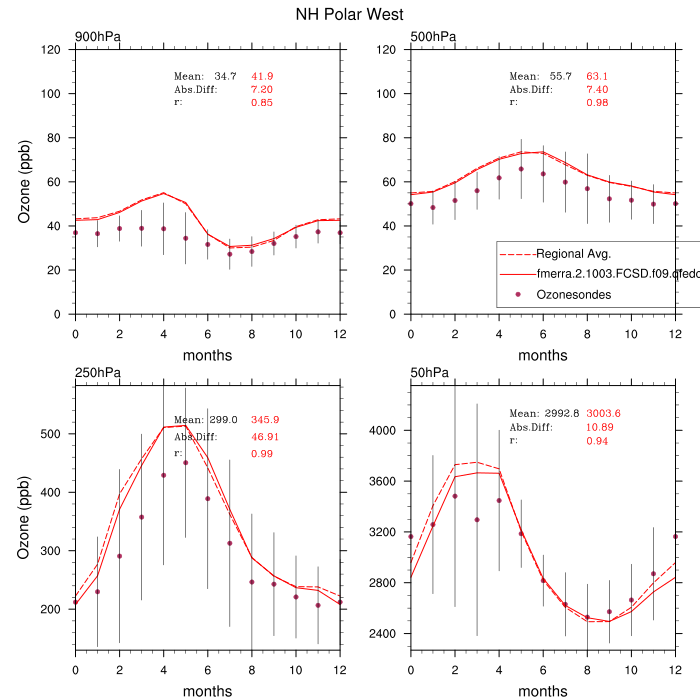
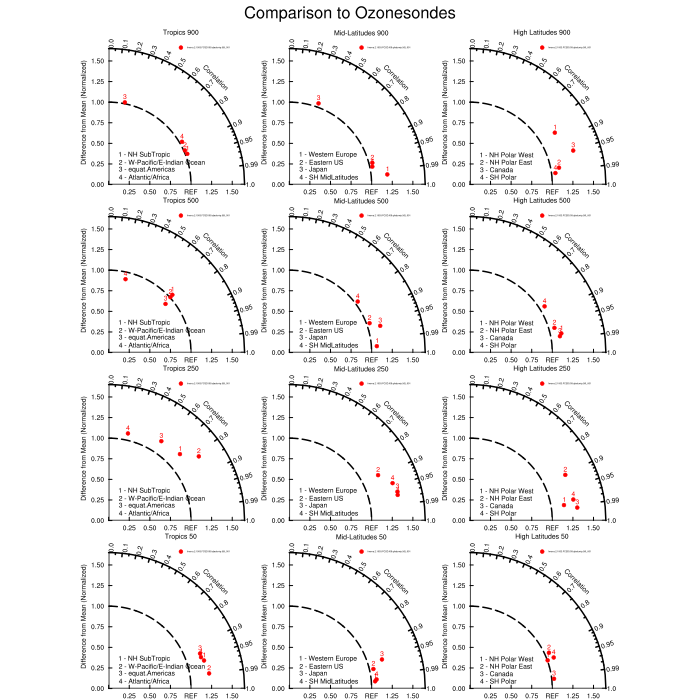
3. Ozone climatology comparison to observations Profiles, seasonal cycles and Taylor diagrams |
Now in the main branch. Has one minor text error with the case name and/or nickname labels that will be addressed in a later fix. | ||
4. Column comparison to satellite observations Lat/lon comparisons for | (a) CO: https://github.com/NCAR/ADF/issues/235 (b) O3: https://github.com/NCAR/ADF/issues/242 (c&d) AOD: COMPLETE | |
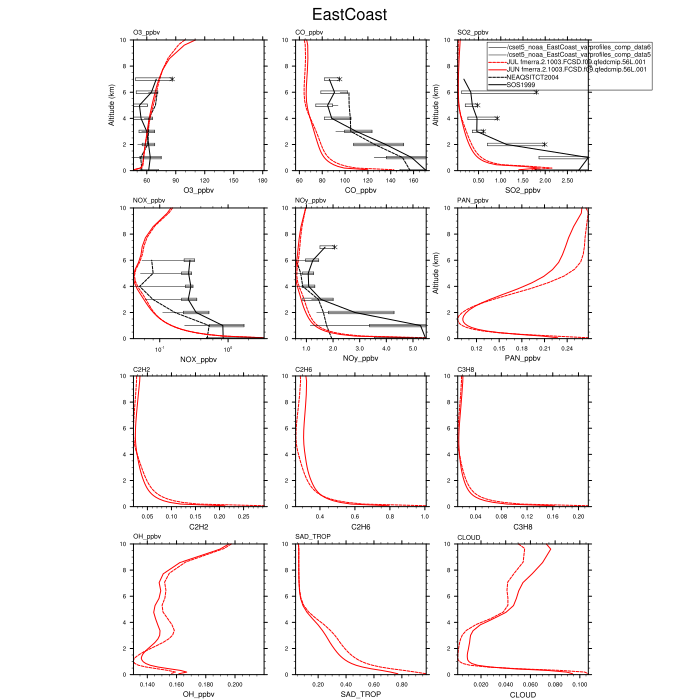
5. Vertical profile comparisons to observations (a) NOAA aircraft campaigns | ||
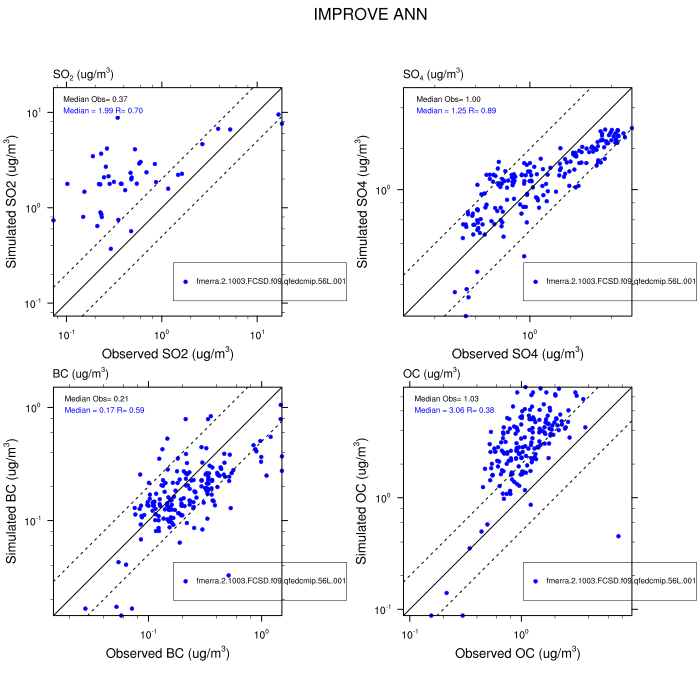
6. Surface comparisons to observations (a) IMPROVE network | ||
7. Water vapor tape recorder | COMPLETE https://github.com/NCAR/ADF/issues/332 Color table adjusted to 1.5 - 3.5. Currently changed in pull request #339. | |
8. Composition map difference plots | COMPLETE https://github.com/NCAR/ADF/issues/331 Pull request #339 initiated. Adds percent change panel to polar, zonal, meridional, and lat/lon plots. |
WACCM ADF Goals (based on these comparisons https://github.com/NCAR/wawg_dev/issues/2):
- QBO QBO, in progress
- Zonal Mean U winds and Transform Eulerian Mean (TEM) of winds
- Water Water Vapor (tape recorder); and temperature time series at 100 hPa in the tropics (compare with MLS) (#7 above)
- Temperature: NH Polar
- Temperature: SH Polar
- Temperature: Dec Zonal Mean (against MERRA and SABER)
- Temperature: June Zonal Mean (against MERRA and SABER)
- Ozone diagnostics for lower stratosphere (ozone hole)
Current example/working diagnostics for WACCM: https://project.cgd.ucar.edu/projects/ADF/chem-diags/seasonal_plots/with-tem/model-v-model/html_img/mean_diag_WACCM.html


